Creator Analytics is an analytical report tool that provides influencers with in-depth data about their account's performance, including follower growth, engagement rate, and top-performing content.
Product
Creator Analytics
Track your performance
Brand Deals
Let paid brand collaborations come to you
Brand Match
Discover potential paid brand collaborations
Media Kits
Craft a professional influencer media kit
Free Tools
Free tools to boost your social media creator journey
Brand deals
Pricing
Blog
Track your performance with creator analytics
Get in-depth analytical reports about your social media accounts' performance. Understand your authentic audience and find out exactly how engaging your content is to help you plan going forward.
Learn the ins and outs of your account progress
The first step to leveling up your career as an influencer is to understand what works and what doesn’t. With a detailed account report, you’ll come to learn which posts are resonating most with your audience – and how to tailor your content strategy to boost your engagement rate and monetization opportunities in the future.

Get to know your audience
Learn about their location, age, language, and other vital demographics. To make sure this is relevant, we filter out inactive followers and focus on active users who engage with the posts you put out.
Spot fake Instagram followers
Easily uncover the percentage of suspicious accounts and bots that might be hiding among your followers. Determine the quality of your audience to help figure out how appealing it would be to brands.
Zone in on your performance
Get a detailed look at how your account is progressing with a summary of your engagement rate dynamics, account growth, hashtag analysis, and much more.
View your account quality at a glance
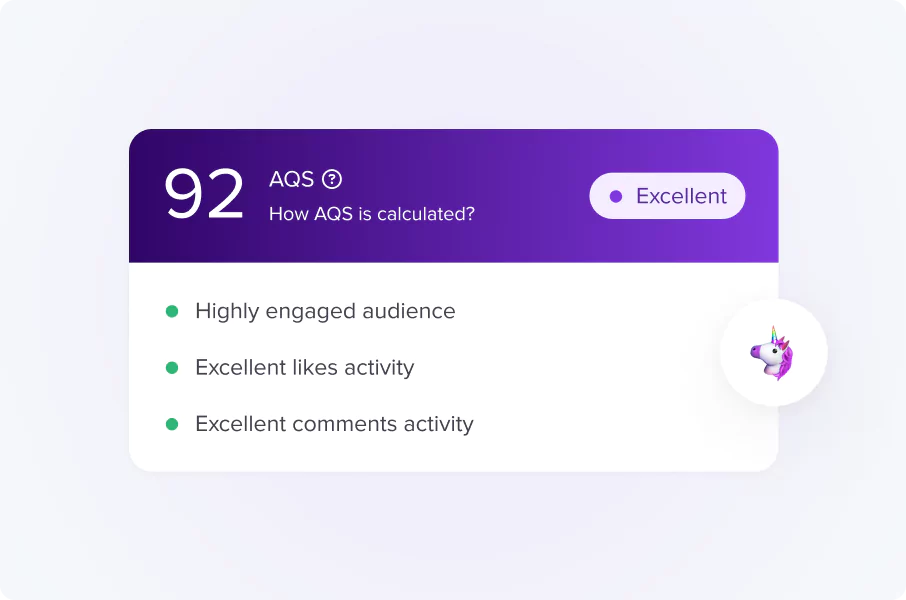
HypeAuditor’s proprietary Audience Quality Score (AQS) is used by brands to quickly vet influencers based on their audience. By using this metric, you can view your influencer brand through the lens of brands and know where you stand.
Gain insights into other influencers
Our analytical reports aren’t just for your own account’s performance. Check out similar influencers to see how you compare or decide whether they’d be a good fit for collaborations down the line.

HAFI Creator Analytics Quick Start Guide
What is the Creator Analytics feature on the platform?
How do I access my Creator Analytics?
To access your account's analytical report, simply log in to your account on the platform and navigate to the Reports section. Alternatively, select the “see full report” option on your dashboard. Starter and Pro accounts have access to the full social media performance report, while Free accounts will be able to access a limited version of the report.
Which platforms can I analyze with Creator Analytics?
Currently, we provide content creator analytics for Instagram, TikTok, and YouTube.
How often is data updated in the analytical reports?
Analytics for content creators are updated daily for the Starter and Pro plans. In the free plan, influencer stats are updated every 3 days.
What is the benefit of using Creator Analytics?
Using the Analytical Report can help influencers gain a better understanding of their social media performance, and identify areas for improvement.
Social media platforms often update their algorithms, affecting influencers’ reach and visibility. This will cause a change in their views, comments, shares, and likes, impacting their engagement rate as well. If you monitor closely your social media performance you’ll be able to see declining tendencies in your engagement numbers and can quickly adjust your content strategy accordingly.
Your account analytics help you understand what content resonates with your followers and what hashtags produced the highest engagement rate. This will help you tailor your content to their preferences and improve your reach.
Nowadays, brands check influencers’ audience analytics: quality, reach, engagement, and brand affinity before they approach them. By relying on your account analytics, you can optimize your posts and videos, increase your followers and engagement, and secure brand collaboration deals.
With the content creator analytics feature, you can get a glimpse at your account’s general progress but you can closely examine data related to your audience, content, engagement, and growth and you can explore creators posting about similar topics.
Eventually, your social media performance report will help you make data-backed decisions to grow your Instagram followers or YouTube subscribers, optimize your content strategy, and secure brand collaborations.
What kind of data is included in the report?
The analytical report for an influencer's account on HAFI includes a comprehensive breakdown of influencer statistics such as average likes, comments, engagement rates, and growth and engagement dynamics. It also provides audience information including the percentage of fake followers, audience location, type, general demographics, interests, and AQS (audience quality score). The report additionally provides you with content and hashtag analysis, the ability to check the difference between sponsored and non-sponsored content and identify notable commenters among your audience.
Key Instagram metrics you can access through the creator dashboard
Here’s a short rundown of the metrics you’ll find in you can find in your Instagram creator analytics report.
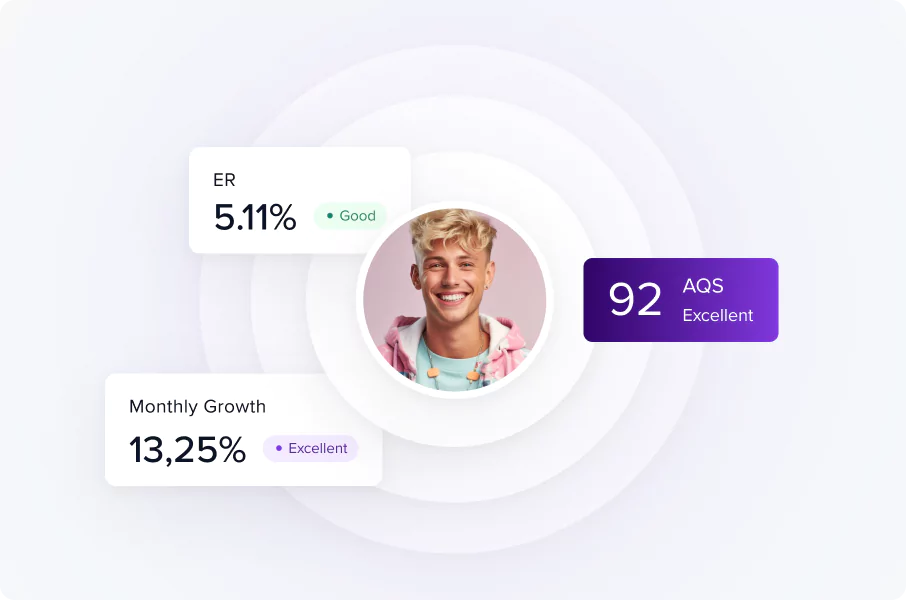
AQS: Get to know your global and country rank in the Overview section besides metrics like follower growth, ER, post frequency, quality audience, and AQS. The Audience Quality Score (AQS in short) is HypeAuditor’s proprietary metric that rates Instagram accounts between 1 and 100 based on several key metrics including audience quality and engagement authenticity. The AQS gives businesses an initial impression of your Instagram account’s quality. Accounts with a score of 90 or higher are rated Excellent. Instagram accounts between 80 and 90 are marked as Very good, while those that got a score between 60 and 80 are rated Good. Accounts between 40 and 60 points are Average, user accounts between 25 and 40 scores are ranked as ‘Could be improved’ and accounts less than 25 are ‘Poor’.
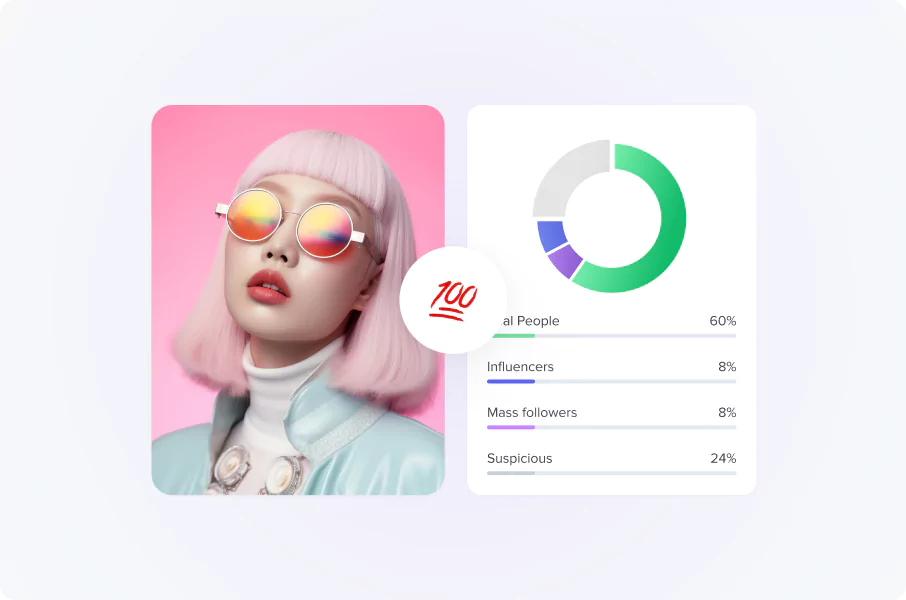
Quality Audience, Audience Types: We differentiate four audience types: real people, influencers, mass followers, and suspicious users.
Real people are average users with regular activities.
Influencers are people who have over 5,000 followers.
Mass followers are accounts that follow more than 1,500 accounts.
Suspicious accounts are bots and individuals who use automated services to increase their followers or engagement.
Your quality audience consists of real people and influencers. Make sure that at least 80% of your followers are made up of these two categories.
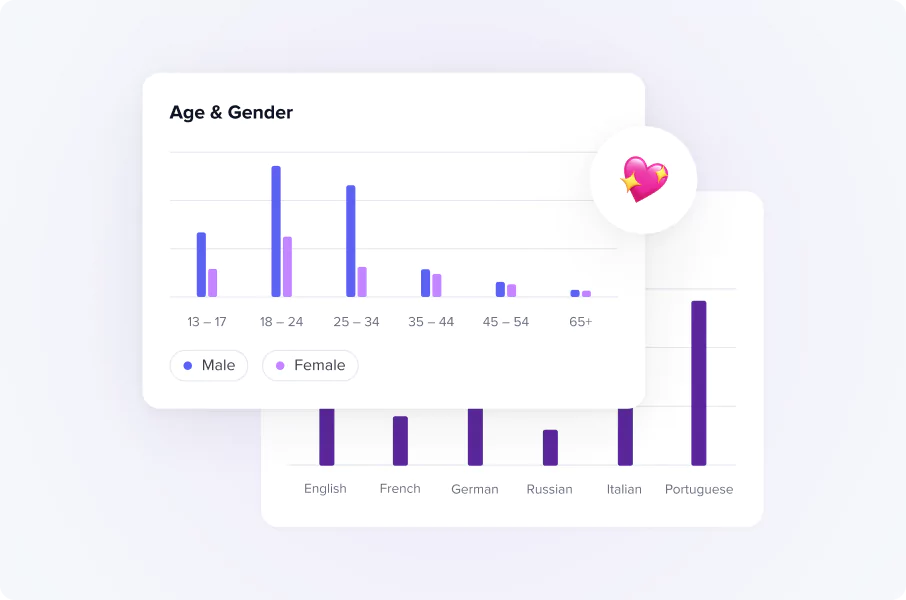
Audience demographics: We break down your audience by gender and age and display the top gender and top age separately. The content creator analytics dashboard details which countries your followers are from. Let’s see an example: The top location metric is Australia 68%, the top gender is male 53%, and the top age group is 25-34 27%. Accordingly, 68% of your followers are Australian, 53% are male, and 27% of them are between the ages of 25 and 34. You can also check your audience’s language and interest. You may discover that your audience’s interests can be very diverse depending on your content. If you post about outdoor activities and eco-friendly backpacking practices, you can attract people interested in sustainability and environmentalism together with those curious about camping, hiking, and trekking.
Notable commenters and Mentioned by: We list influential people who interacted - liked or commented - with your content under Notable commenters. Discover which influencers and brands mentioned your account within 180 days by checking the Mentioned by section.
Growth metrics: The analytics report provides information about your yearly account growth. Your Instagram followers and following charts will provide you with a visual understanding of your growth dynamics. Relying on various suspicious patterns, our machine learning algorithms detect unusual practices and we’ll let you know about them.
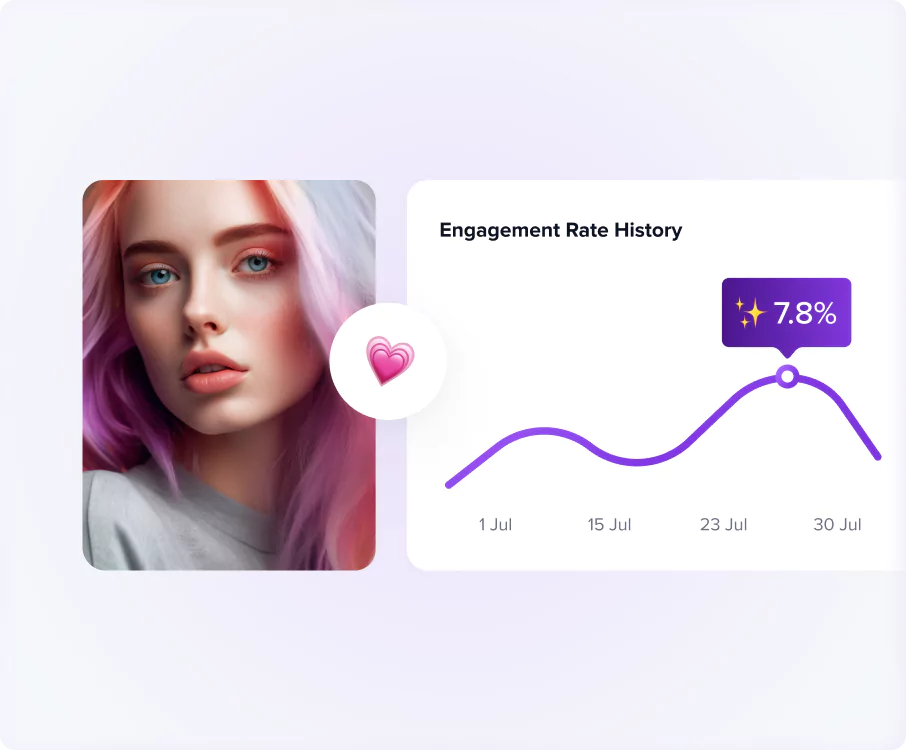
Engagement: Your Instagram analytics has a dedicated report on engagement metrics. You can check how many likes and comments your post gets on average in the last 30, 90, and 180 days or the past year. Using historical data, we display how your engagement has changed and you can also learn more about your engagement rate (ER).
Simply put, the engagement rate measures the level of engagement your post received. To calculate ER we add the likes and comments, divide this amount by the number of followers then by the number of posts. As a reference, the average ER on Instagram was 1.85% in 2023.
We also share with you data connected to comments. The comment ratio reflects the number of comments your content received in relation to your follower size. We analyze comment authenticity and determine the comment-to-like ratio as well. The latter indicates how many comments a piece of content receives compared to the number of likes.
Sentiment analysis: We gauge users’ reactions and emotions toward your content and classify user sentiments as positive, negative, and neutral. If you experience a shift to a negative or neutral direction, you may have to rethink your content strategy.
Likes spread: We exhibit how many likes your last twelve posts received on a graph. A chart with scattered dots shows that you probably didn’t pay for likes and just simply reflects that your audience prefers some content over others.
Brand safety analysis: We assess your content looking for compromising or upsetting topics, including alcohol, negative sentiments, crime, toxic, offensive, and adult content, religious and political themes, and pranks causing discomfort or embarrassment to others.
Sponsored content ER: We consider posts where you mention brands and compare their engagement rate with regular posts’ ER. If your ad ER performance is as good or even better than your organic content’s ER then you’ll probably attract potential brand collaborations.
Similar accounts: We list several identical Instagram accounts to yours. You may use this information to compare your performance with theirs.
Important YouTube metrics in your content creator analytics
We’ll discuss critical metrics and how to read them relevant to your YouTube creator analytics dashboard.
CQS: The Channel Quality Score ranks your YouTube channel’s performance from 1 to 100 based on multiple factors, like your subscriber number, influence, posting consistency, audience authenticity, and engagement. YouTube CQS scores are determined similarly to Instagram AQS scores.
Audience demographics and subscriber growth: Your YouTube creator analytics report will detail your subscribers’ gender and age distribution, the countries where your audience lives, and the languages they speak. Discover how many subscribers your audience has grown over the last 30, 90, or 180 days, or over the past year.
Average views: Based on the videos posted in the past 30 days, the average views metric is the median number of views. We don’t count videos uploaded less than 7 days ago.
Additional engagement metrics: Along with the engagement rate history, you can evaluate your average likes and comments, and your YouTube videos’ ER for a certain period.
Views 30 days: We predict how many views your videos can get based on the first 30-day view average of your last 10 videos.
Performance distribution: We indicate how your last 12 videos are performing in terms of views and reactions.
In addition to the above, you’ll find minimum and maximum views per video and you can assess your most engaged, liked, viewed, and commented content too.
Valuable TikTok creator analytics data to track
Let’s see outstanding metrics in your TikTok creator reports.
AQS: Similar to the Instagram metric, the TikTok AQS rates accounts between 1 and 100, with accounts under 25 being labeled as ‘Poor’ and accounts with 90 points or higher being marked as ‘Excellent’. However, TikTok AQS is calculated based on ER, follower growth, and comment ratio.
Engagement rate: Generally, TikTok ER is much higher than Instagram and YouTube ER. The average TikTok engagement rate is at 10%. We calculate ER on TikTok by adding the number of likes, comments, and shares and dividing this by the number of views.
Additional engagement metrics include likes, comments, views, and share averages per post. This information can help you evaluate your content’s impact on your audience for various periods. Naturally, the average reactions per post vary similarly to the likes spread on Instagram reflecting your audience’s preferences in terms of content.
Average views per post: We calculate a median number of average views for the last 30 posts and compare it with the views data of a previous period.
Audience authenticity and Audience types: We classify four audience types.
Generators who create a lot of content.
Influencers who have more than 5,000 followers.
Consumers, who mostly consume content.
Suspicious users, who don’t seem real individuals.
An authentic TikTok audience is made up of generators, influencers, and consumers.
In the Audience report you’ll find in-depth audience demographics stats, including age and gender distribution, languages, and location.
Viral potential: Your audience composition determines how likely a challenge launched by you can go viral. Generators and influencers possibly would join the challenges. The higher the number the higher your viral potential metric will be.
Growth data: We exhibit your TikTok account’s yearly follower growth, and you can study your followers and following growth charts in the past 30, 90, and 180 days or for the past year. A steady decline in your follower growth can mean that your content isn’t vibing with your audience.
Likes growth: In the growth section, you can check your likes growth graph to measure how much more engagement your short videos elicited from your followers.
Can I check my competitors?
Yes, you can explore other influencers’ Instagram, TikTok, and YouTube analytics and learn from their moves. Whether you’re researching your competitive landscape, trying to find collaborative partners, or simply looking for inspiration, our analytics reports tool can provide you with information about their engagement and growth metrics, audience demographics, content performance, and brand collaborations.
What can I learn about my followers through the Creator Analytics dashboard?
We created reports for your audience characteristics and follower growth metrics within the platform. The creator dashboard provides ample information about your audience’s geographics, including top countries and - for Instagram influencers - top cities. You can discover the proportion of male and female followers, their top ages, and languages. The Instagram creator analytics report encloses audience interests and noteworthy people who have commented on your content. With the Instagram and TikTok creator analytics dashboard, you can check your audience quality and authenticity as well.
Our tool compiles comprehensive data about your follower or subscriber growth dynamics for 30, 90, 180 days, and one year. Besides their followers, Instagram and TikTok content creators can explore their following charts as well. These graphs can reveal anomalies in your audience fluctuation and confirm conducting a thorough audience analysis. If you post content on more social media channels, you can find out from the growth rate of subscribers or followers what type of content your audience prefers.
Can I use the Content Creator Analytics feature for free?
Yes, you can use the analytical feature for free and access basic stats, like the number of followers or subscribers, average likes and comments, and engagement rate. In the paid plans you’ll be able to access 30+ metrics in your creator dashboard.
By continuing to browse this website, you accept our
cookie policy.